Enhance Your Virtual Showroom with Multimedia and Measure it’s Effectiveness with LESA Stats Reports

Historically, dealerships have spent top dollar to ensure they have great show rooms to showcase cars. As the car shopping environment continues to transform digitally, dealerships should now put a greater emphasis on ensuring they have a great virtual showroom. Many car dealerships neglect the digital show room by showing static photos, but a multimedia experience is necessary to appeal to the new generation of online shoppers. Your website is one of your greatest assets in 2022 and its essential to continually enhance and monitor performance
LESA online video statistics portal is helping car dealerships review their vehicle video website data to make better vehicle merchandising decisions and optimize their website. Additionally, LESA has thousands of dealerships with multimedia data which helps us analyze important consumer behavior and trends across the nation, helping give your dealership a competitive edge.
Let’s take a look at what the video statistics portal can offer your car dealership better understanding on how to help consumers that prefer visiting a digital showroom. Part I of this article will cover the overall video statics report, and Part II will break down specific details into what consumers are interested in and a deeper analysis of consumer behavior. Your dealership will benefit from understanding the impact multimedia has on your website.
Part I: Overall Video Statistics Report
The overall vehicle video statistics report offers a comprehensive view into how your vehicle videos are performing on your website. Let’s take a look at the dashboard and break down each part.
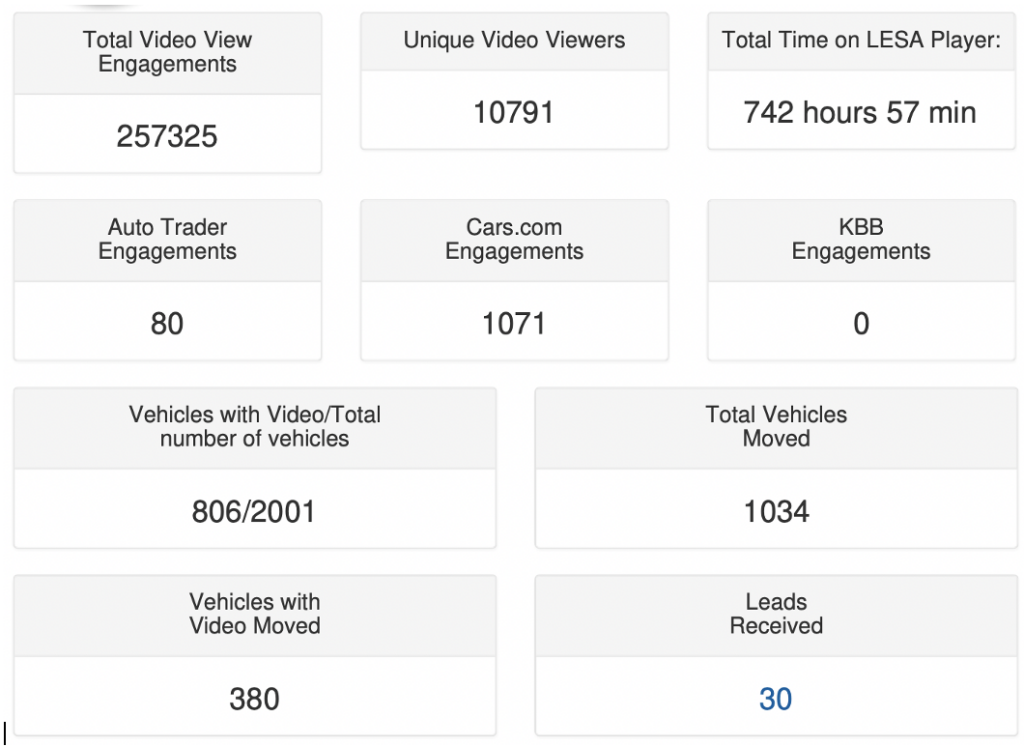
Total Video View Engagements: The total number of video view engagements from the dealerships walk around video traffic. This includes engagements from the dealerships website(s), AutoTrader, KBB, Cars.com, and others. For example, other engagements can come from the dealerships Facebook video inventory gallery, and views from a shared link of a full motion video.
Unique Video Viewers: The total number of unique video viewer IP addresses that accounted for watching at least one video. If more than one person from a single router IP address watch video, then only one unique viewer is counted for that routers IP address. For example, If two people from the same household watch videos of vehicles, they are treated as one unique video viewer for that routers IP address.
Total time on LESA Player: The total time spent on the LESA multimedia player on the dealerships website, including videos, photos, feature videos and 360 spin. This number gives a great representation of the impact multimedia has on your dealership website. This number is very important to monitor as the more time spent on your website, the more likely it is that people are interested in your vehicles. Dealerships can also compare this stat to similar metrics in Google Analytics prior to implementing multimedia to see the difference in engagement.
AutoTrader Engagements: The total number of view engagements from AutoTrader. This total is included in Total Video View Engagements.
cars.com Engagements: The total number of view engagements from Cars.com. This total is included in Total Video View Engagements.
KBB Engagements: The total number of view engagements from KBB. This total is included in Total Video View Engagements.
Vehicles with Video: The total number of both active and any sold vehicles shot with video within the specified month of reporting.
Total Vehicles Moved: The total number of vehicles in inventory that left the dealership.
For example, when a vehicle is sold it is counted as a vehicle moved.
Vehicles with Video Moved: The total number of vehicles in inventory that had video taken before they left the dealership.
Leads Received: The total number of how many times a customer filled out the “more information” form attached to the video. It’s important to keep in mind that leads from your website can come through many different ways, so the leads captured on the multimedia player are just a bonus to the numerous leads that come with having a video-centric website.

By Trends
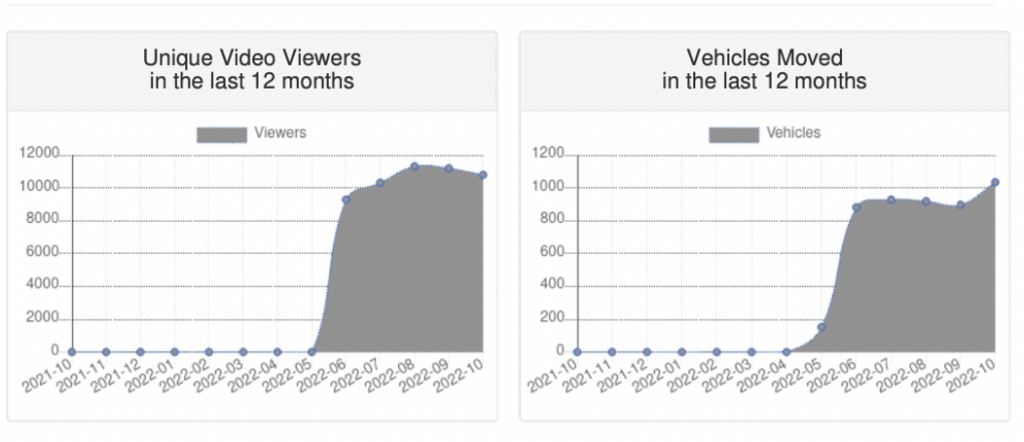
Trends- Unique Video Viewers in last 12 months: A line graph displaying Unique Viewers that can span over the last 12 months. This helps a car dealership gauge how many new views the vehicle videos are bringing to the website.
Trends- Vehicles Moved in last 12 months: A line graph displaying the number of vehicles moved over a span of 12 months.
LESA has analyzed hundreds of dealership data, and has found there is a direct positive correlation between the video viewers and vehicles sold. The more viewers of videos results in an increase in vehicles moved.

By Technology
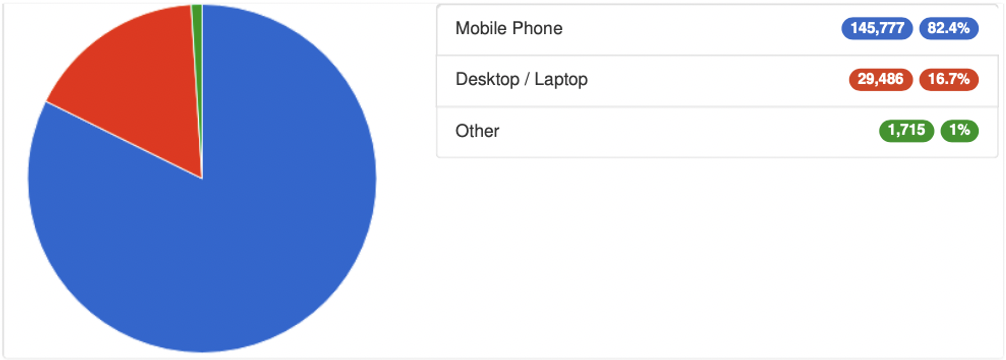
Engagement by Platform: The total View Engagements measured in a pie chart by Platform.
Mobile Phone, Desktop/Laptop, Tablet, are the platforms tracked. Any view engagements not traceable to a platform are listed as Other. This can help car dealerships understand the percentage of engagements that come from mobile devices. Websites may need to be specifically tailored to attract mobile users.
Websites may need to be specifically tailored to attract mobile users. Five years ago, traffic consisted from half desktop and half mobile. We have seen through analytics that mobile consists of 80%+ of visits. We highly recommend car dealerships to have a mobile friendly approach. Our LESA multimedia player is very mobile optimized and can easily accommodate for visitors shopping for cars on their phones.

How Is The Overall Overview Report Helpful?
This section allows you to see the impact that multimedia is having across your website and the dealer’s third-party car portal websites. You can gauge how many views, engagements and leads are being created from your LESA multimedia player. Additionally, you can keep track how many cars for sale currently have video, and how many cars with videos are selling.
We recommend that dealerships compare data from months prior to implementing multimedia via their Google Analytics Channel to see the power of multimedia. Based on the data LESA has seen from hundereds of dealerships, it will prove the effectiveness and power of creating an engaging and excellent digital showroom.
To be Continued
In Part II, we will break down the second part of the statitics report which will break down specific details into what consumers are interested in and a deeper analysis of consumer behavior.

