Part II: Enhance Your Virtual Showroom with Multimedia and Measure it’s Effectiveness with LESA Stats Reports

In Part I, we discussed the importance of having a great virtual showroom as online car shopping continues to soar in popularity. Static photos won’t be enough to engage online car shoppers, and a multimedia website experience continues to be dynamic and beneficial for car dealerships.
LESA’s overall stats portal helps offers a comprehensive view to how your vehicle videos are performing on your website. Part II of the LESA stats report has numerous other statistics that continue to prove the effectiveness of multimedia and give dealerships insight into viewer behavior.
Let’s take a look at the type of insights your dealership can get with our custom report. Below is a stats report from one LESA dealership, but we see similar patterns across our thousands of dealership analytics.
Part II : Multimedia Results in Higher Website Engagement
By Viewer
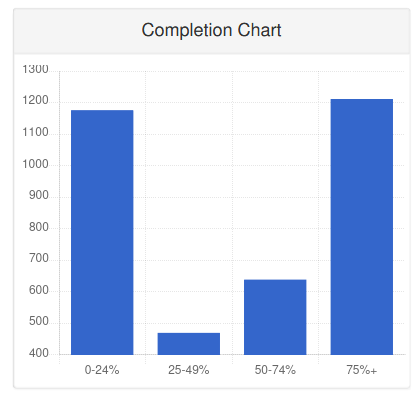
Completion Chart: How much of the video watched was completed before moving on to the next video or leaving the website. 0-24%, 25-49%, 50-74%, and 75+ %.
If a customer watched 75% of a vehicle video, one count would be added to the 75-100% column. Across our data from thousands of LESA dealerships, the completion chart is typically U-shaped with 0-24% being high, and 75%+ being high.
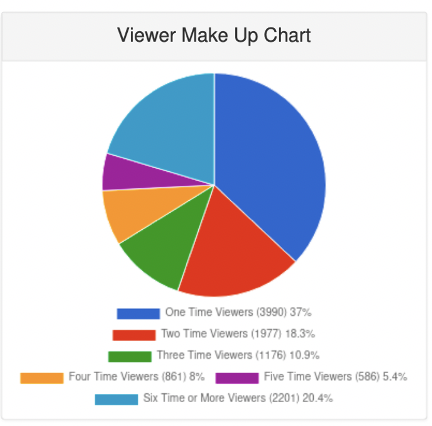
Viewer Makeup Chart: This chart represents the number of times a video was watched per unique viewer. If a unique viewer watched 4 videos they would be counted as a four-time viewer.
What does this mean? Very few people watch half the video. People either quickly determine they are not interested in the car, or they will watch the entire video. In this dealership, we see that slightly more than 20% of people watched 6 or more videos. This is very common across the board from the data we have analyzed from all of LESA dealerships. Videos are very engaging and can help consumers stay focused on your website
By Time Period
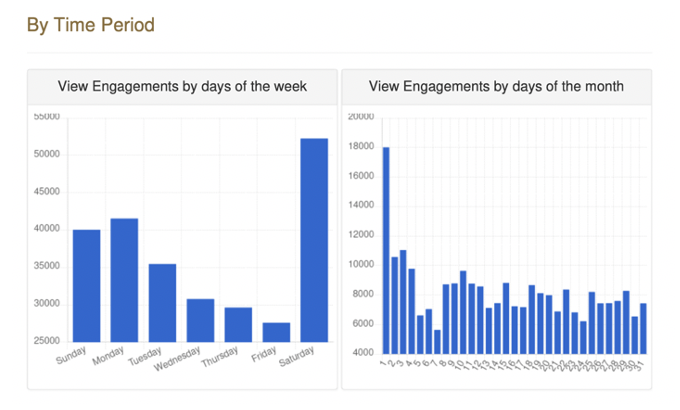
View Engagements by days of the week: The total number of Video View Engagements that occurred on each Monday – Sunday for that month of reporting. This may help car dealership understand which days they have the most engagement each week, prompting them to post new content on these days.
View Engagements by days of the month: The total number of Video View Engagements that occurred on each day of the month. If you see a spike, it could be due to a holiday such as July 4th. Usually, there is a spike on the weekends when people have time to shop for cars. This is common and can help you tailor promotions around peak days and hours.
What Does This Mean? Spikes can happen due to holidays or weekends which helps car dealerships determine which days they should publish content and promotions.
Video Engagement By Vehicle Characteristics
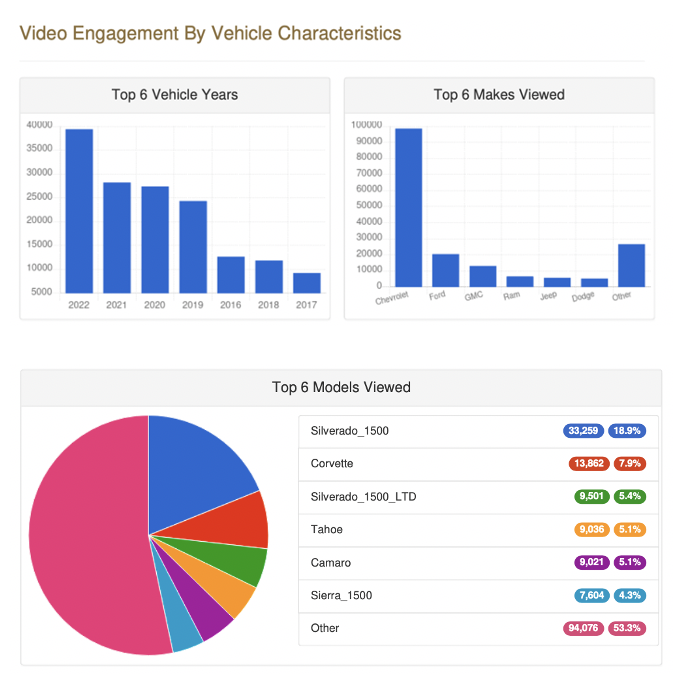
Top 6 Vehicle Years: The top 6 Vehicle Years measured by view engagements. This should continue to trend upward over time as video continues to gain popularity. Our data continues to show that new vehicle videos are very popular! The data trending over time as shown that new vehicle videos are actually some of the most popular.
Top 6 Makes Viewed: The top 6 vehicle makes measured by views engagements. This can help car dealerships determine which cars are the most popular on their website.
Top 6 Models Viewed: The top 6 Models, and all other models shown as ‘Other’, measured as percentages on a pie chart. The totals are from by view engagements for that Model. This can help car dealerships determine which models are the most popular on their car dealership website.
What Does This Mean? It allows the dealership to do direct measurement of vehicles. For example, if the dealership has any doubt that showcasing new cars is necessary, the data will show you that new models are the most viewed (see below) and shooting new car videos is necessary. It can also help show which models were most viewed helping dealerships properly merchandise and stock cars that people want.
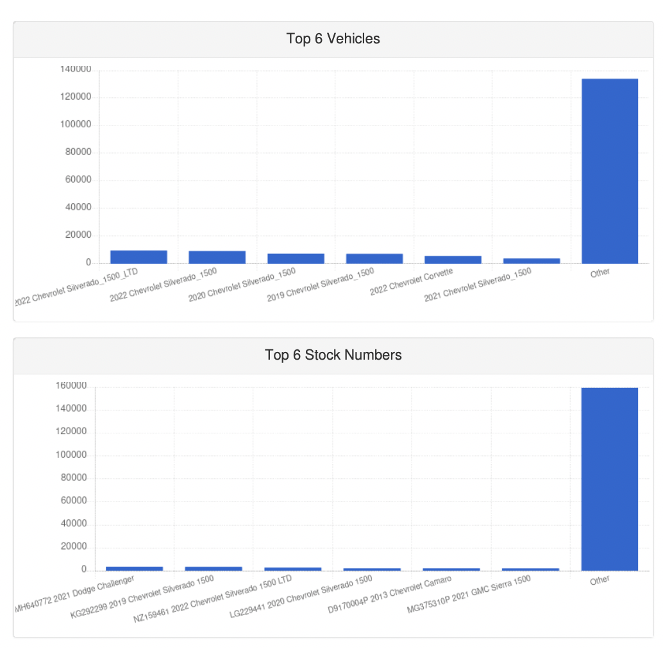
Top 6 Vehicles: The top 6 Year/Make/Model measured in view engagements. Also included is the ‘other’ category which includes the number of engagements for the rest of the year/make/ models outside of the top 6. This can help car dealerships gauge which vehicles were the most viewed and popular on their website which could signal which cars are in highest demand.
Top 6 Stock Numbers: The top 6 Stock Numbers measured in view engagements. Also included is the ‘other’ category which includes the number of engagements for the rest of the models outside of the top 6.
What Does This Mean?. Dealerships can clearly see if having vehicle videos helped certain cars sell faster compared to those, they did not feature video for (based on hundreds of reports from LESA dealerships- the answer is yes! It does help.)
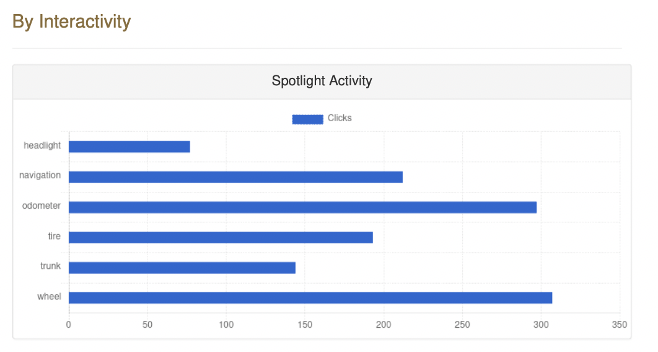
By Interactivity
Spotlight Activity: Tracks the total number of times each spotlight category was hit. This can be helpful to car dealerships in understanding which features of the vehicle are most important to the car shoppers.
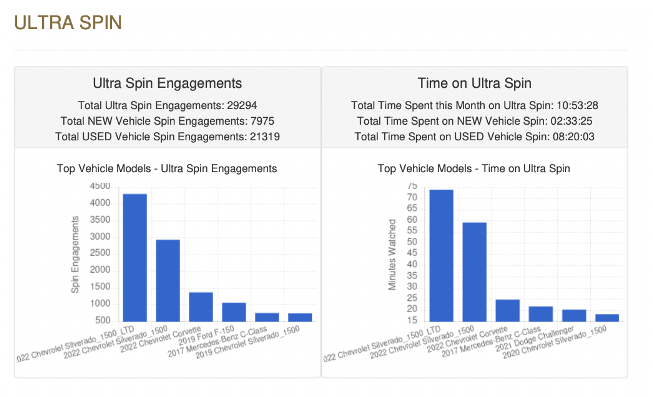
Ultra Spin
Ultra- Spin 360 Engagements- # of swipes tracked when a user is spinning through Ultra- Spin.
Time on Ultra-Spin 360- The total time users spent interacting with Ultra-Spin in the LESA video player on the dealership’s website(s), Cars.com, and anywhere else our LESA video player is interacted with, for that dealer.
What Does This Mean? Based on the data from a dealership below, there were over 10 hours of Ultra Spin views on their website. Not only are consumers engaging on video, but they are also spending a lot of time engaging with Ultra Spin. This highlights that multimedia is an important element of any successful website. It means that your dealership needs a multimedia experience with videos, photos and ultra-spin. They want to learn as much about the car in a multimedia experience.
The Bottom Line:
LESA stats report helps you track engagements and user behavior and measure which vehicles have more views, which models shoppers are more interested in, and which days/hours vehicles are more likely to sell. Stats help dealerships understand which vehicles the consumers are more drawn towards leading to more effective merchandising.
Most importantly, LESA stats portal shows that a multimedia experience is what helps engage consumers, which results in increased time on your dealership website. Video, photos, and ultra-spin are all important elements in helping consumers get a full sense of the vehicle they want to buy. The stats from LESA’s reports and across thousands of dealerships prove that multimedia is what gives your digital showroom a competitive advantage to selling vehicles online.
Get Started With Video Today
In the competitive automotive industry, your car dealership is falling behind if you don’t integrate multimedia throughout your website. Connect with a representative today to get started.